This is progress?
The American economy is 53 times bigger than it was in 1960. How much better did it make our lives? Without further editorializing, let the story be told through graphs, tracing our progress since 1960

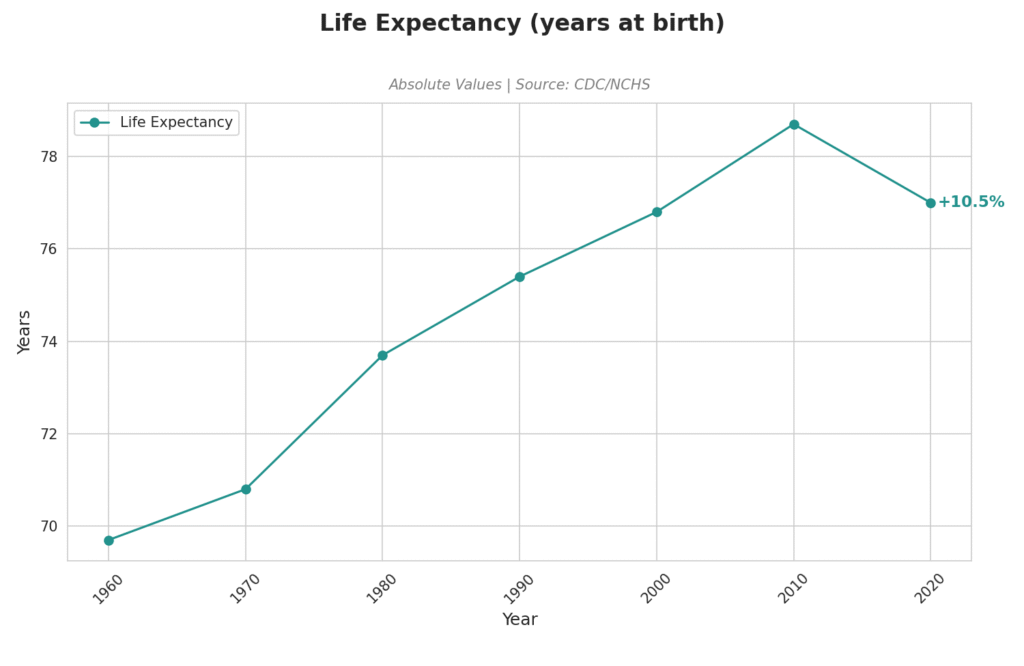
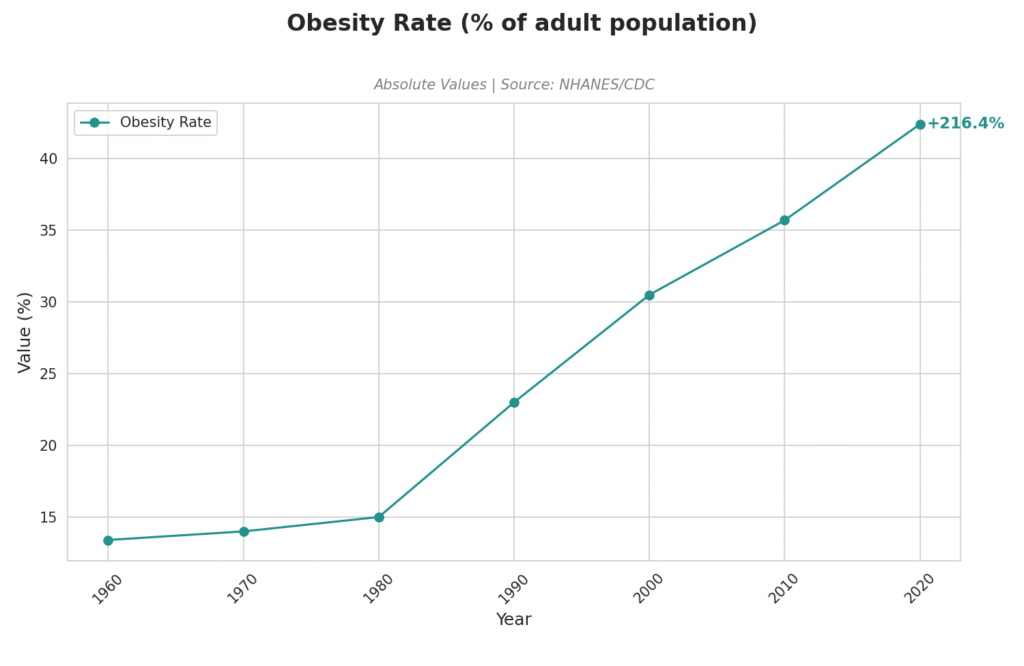
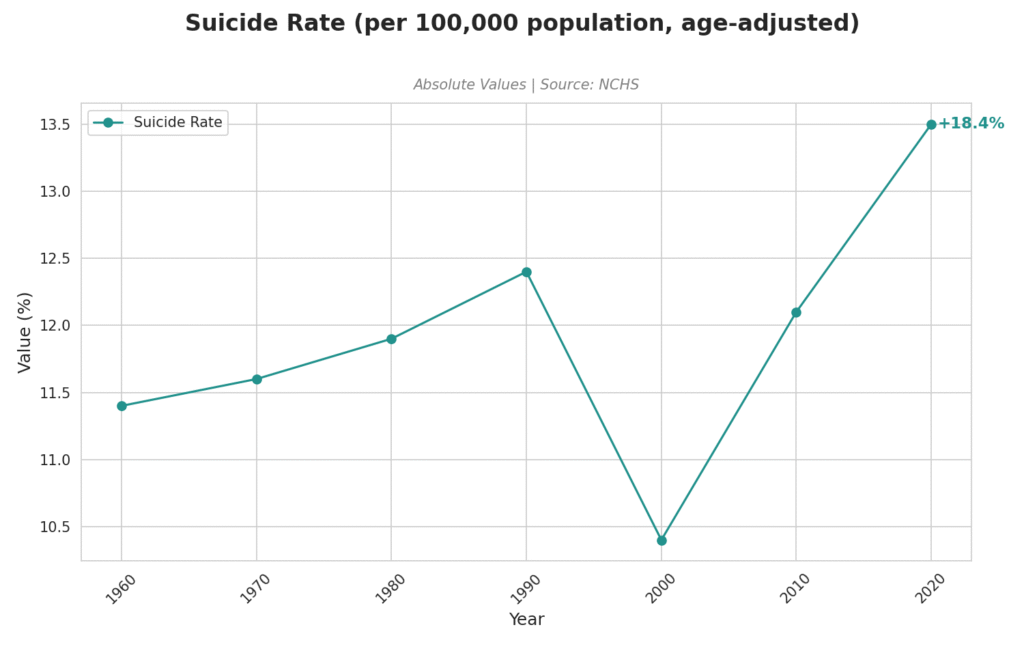
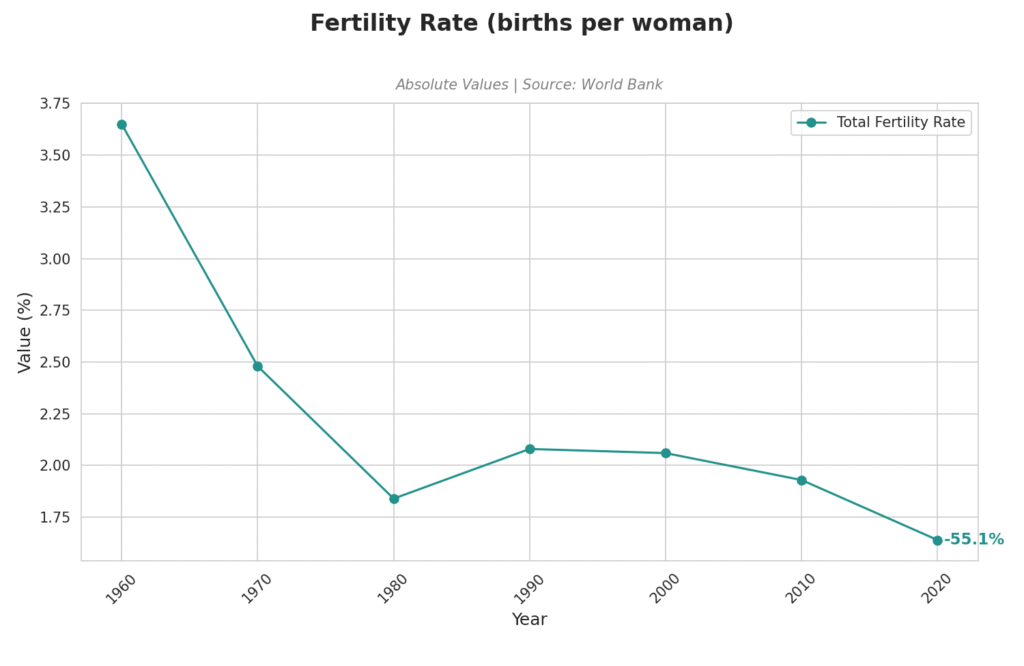
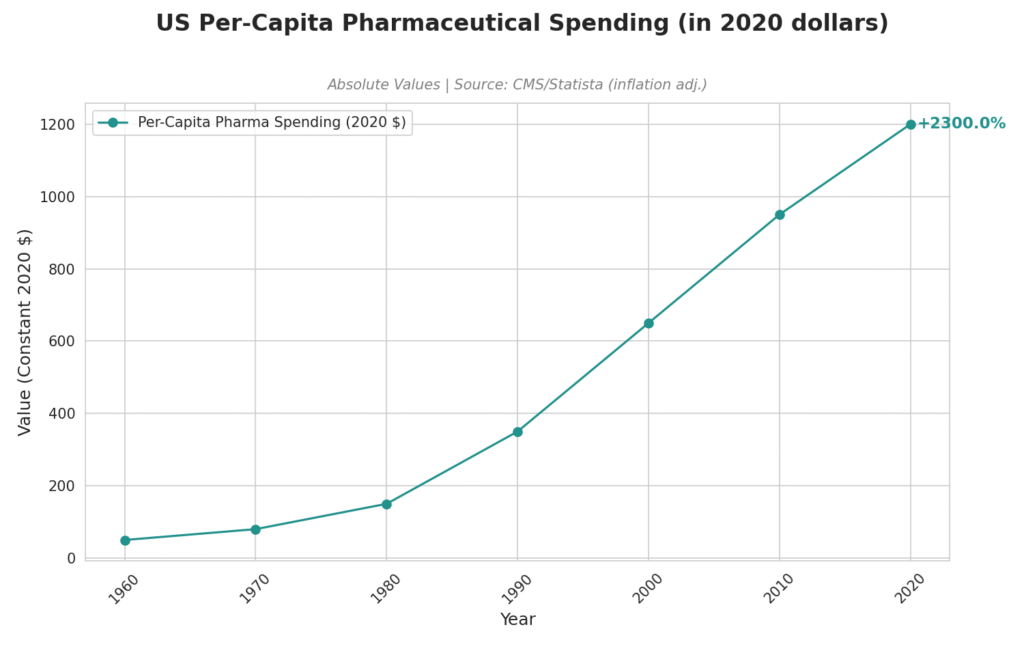
Health and mental health
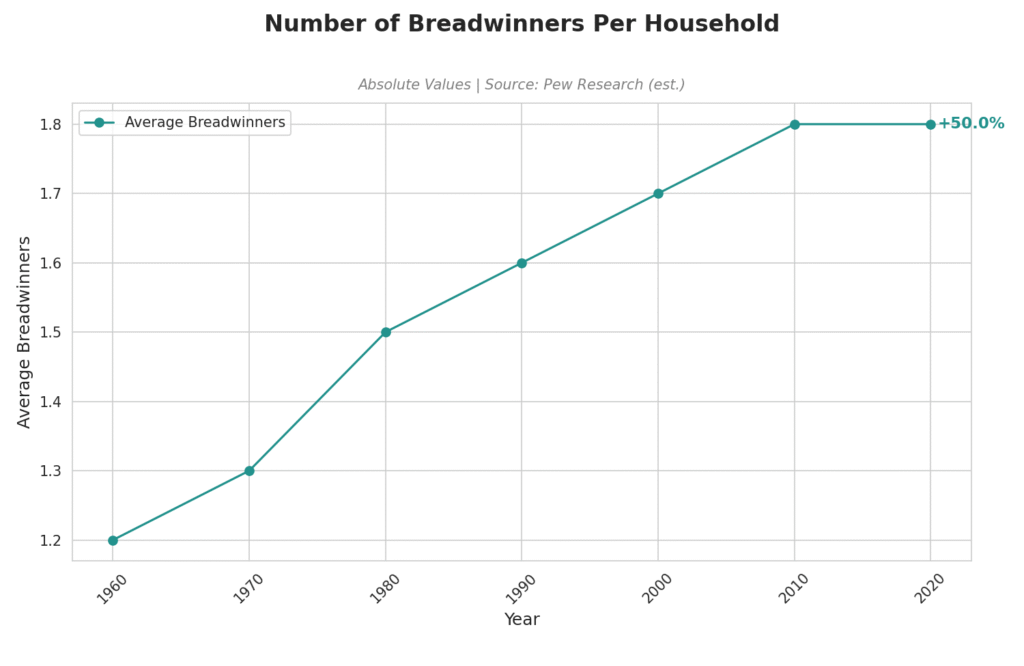
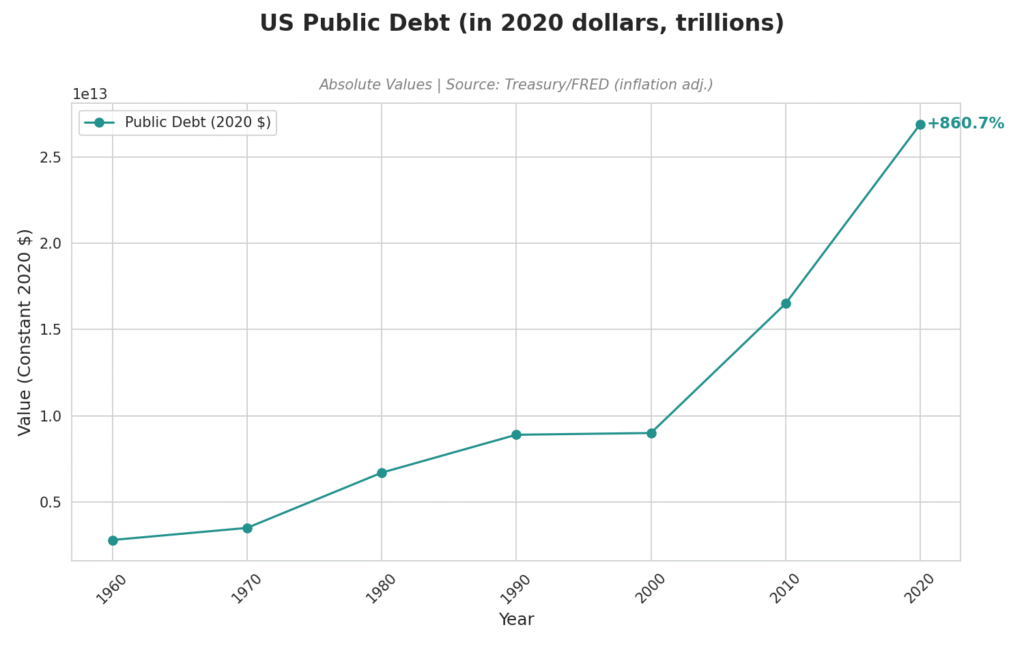
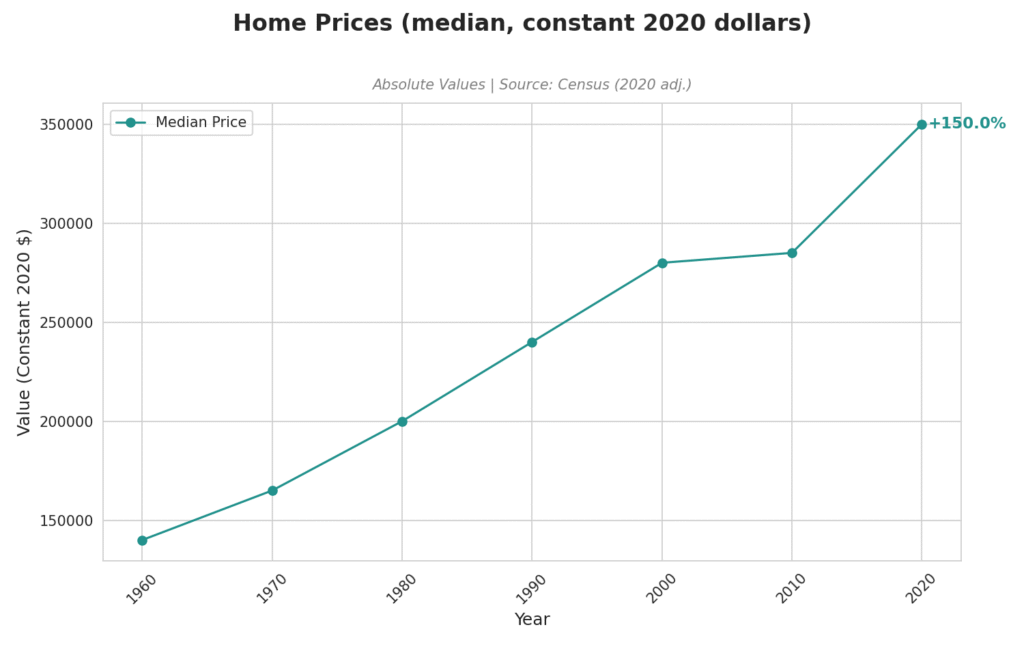
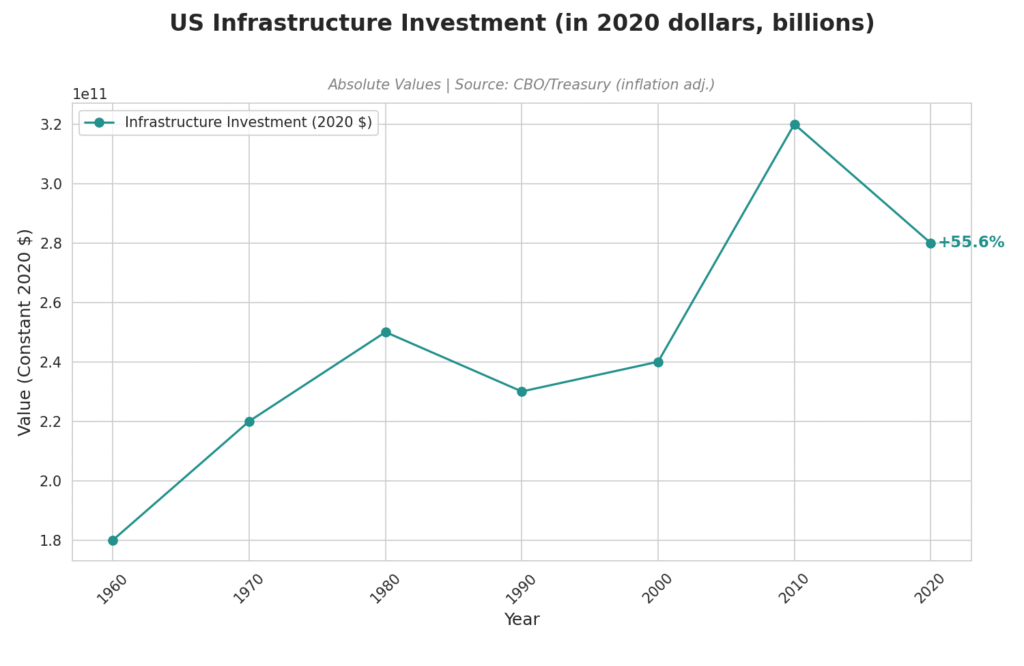
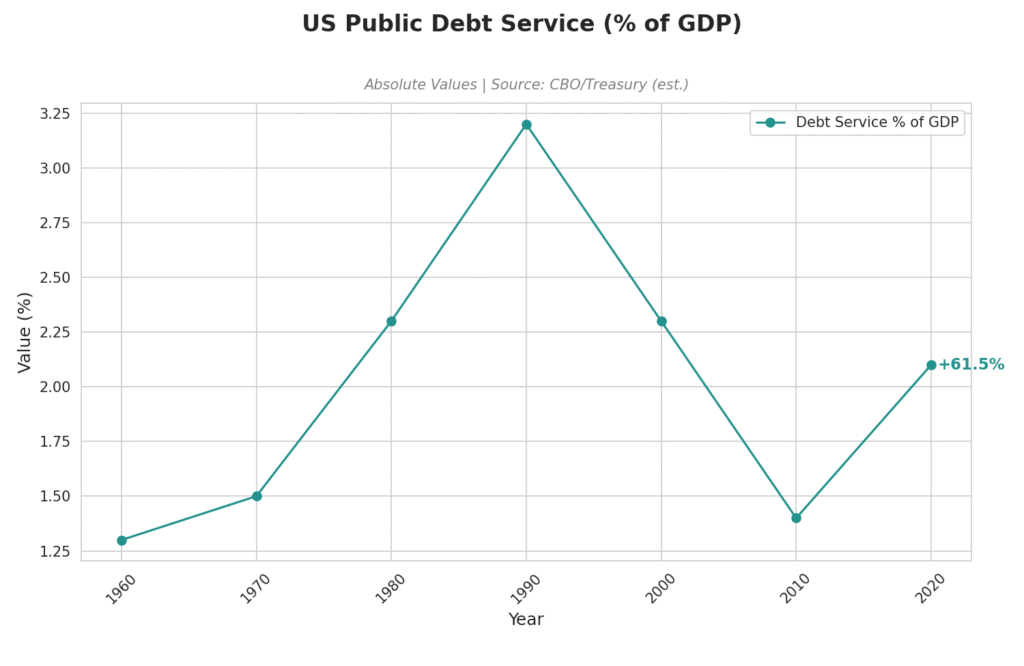
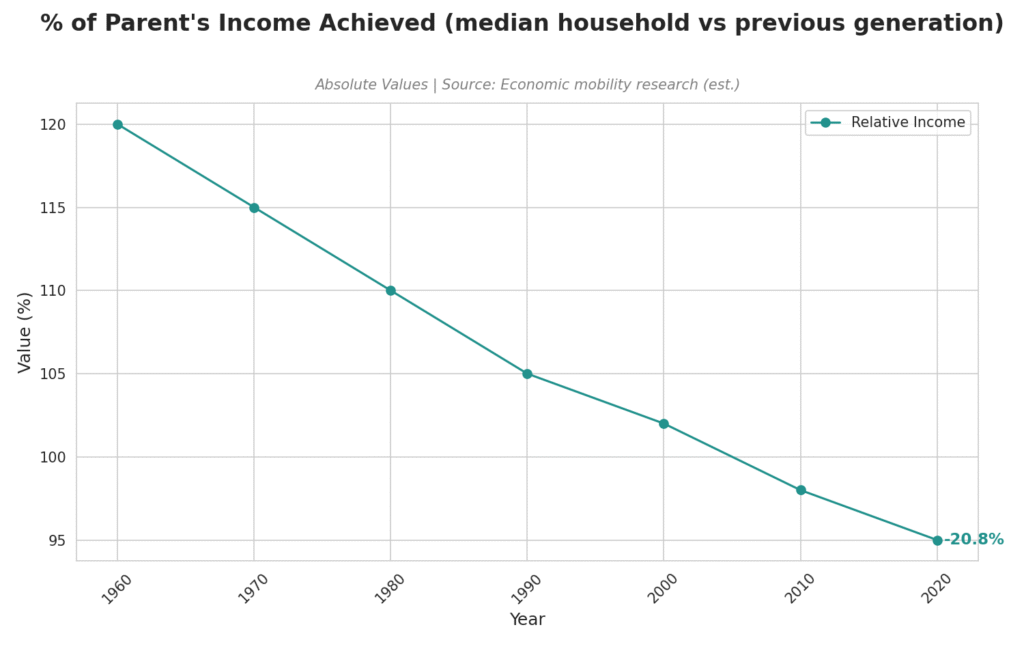
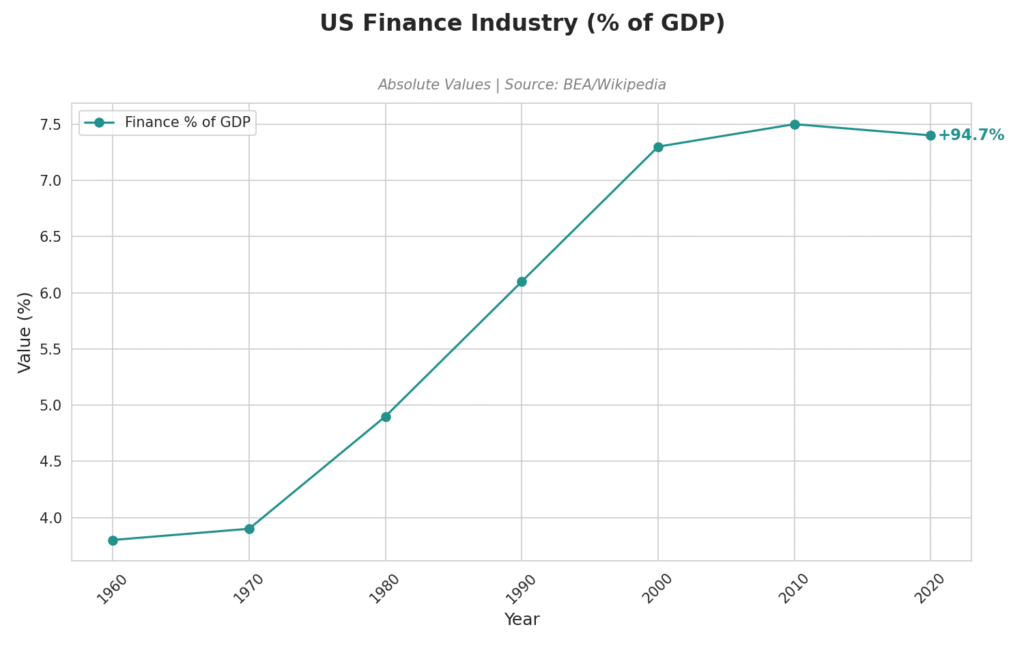
Financial
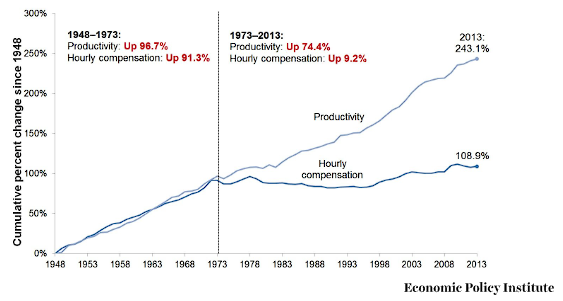
Real income growth vs productivity (1948 – 2013)
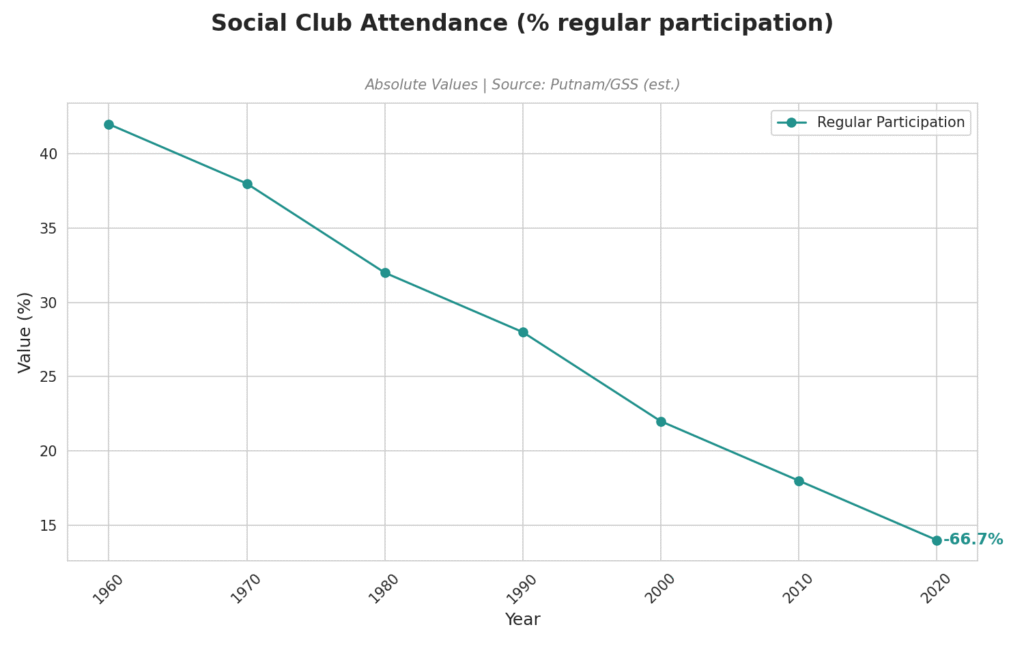
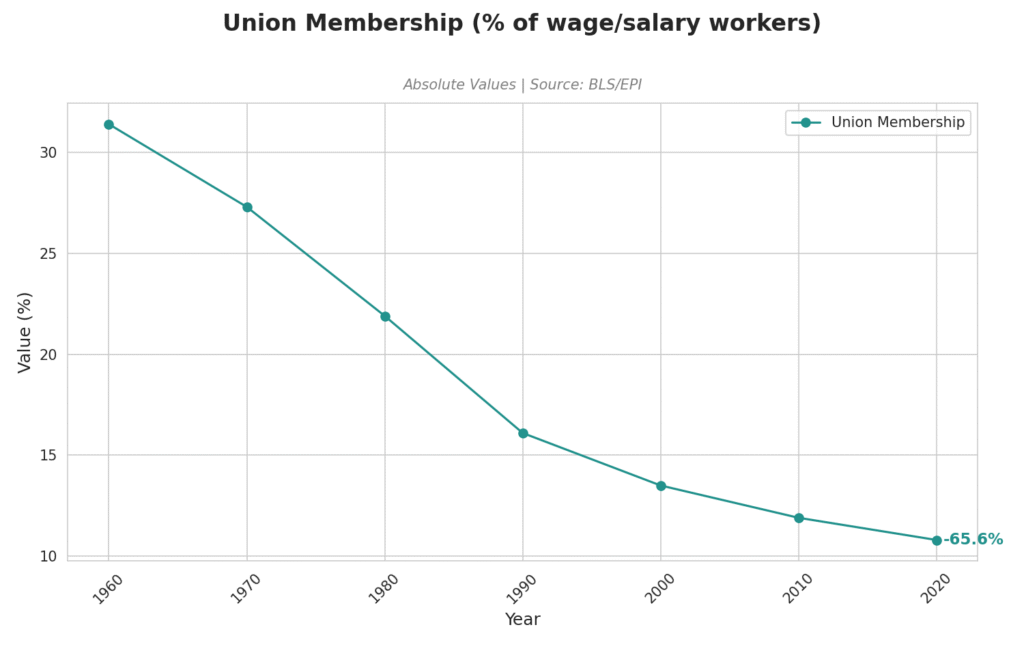
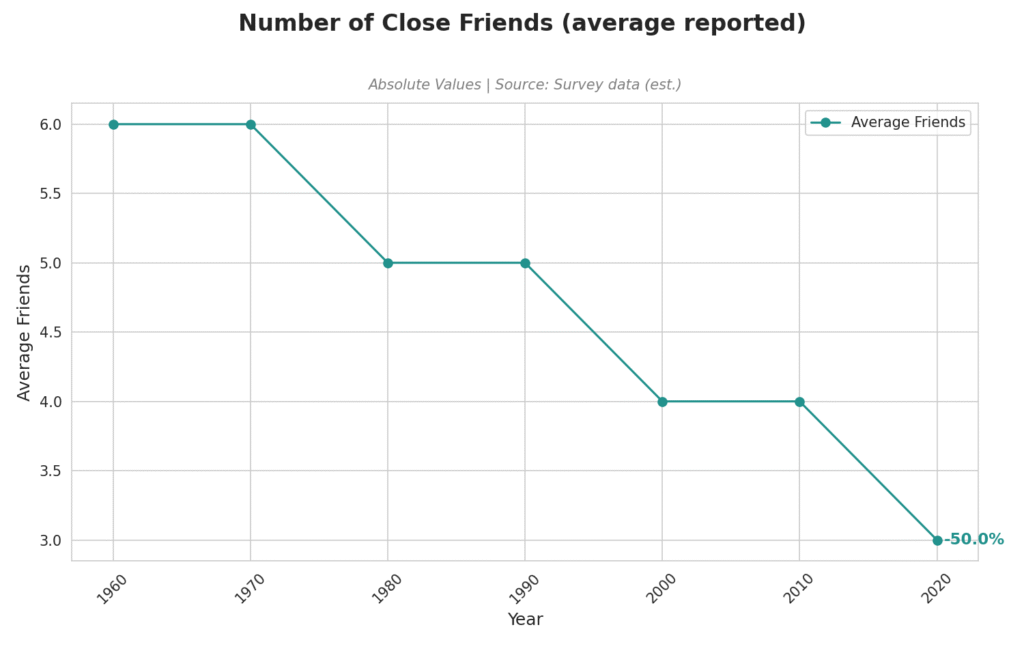
Community
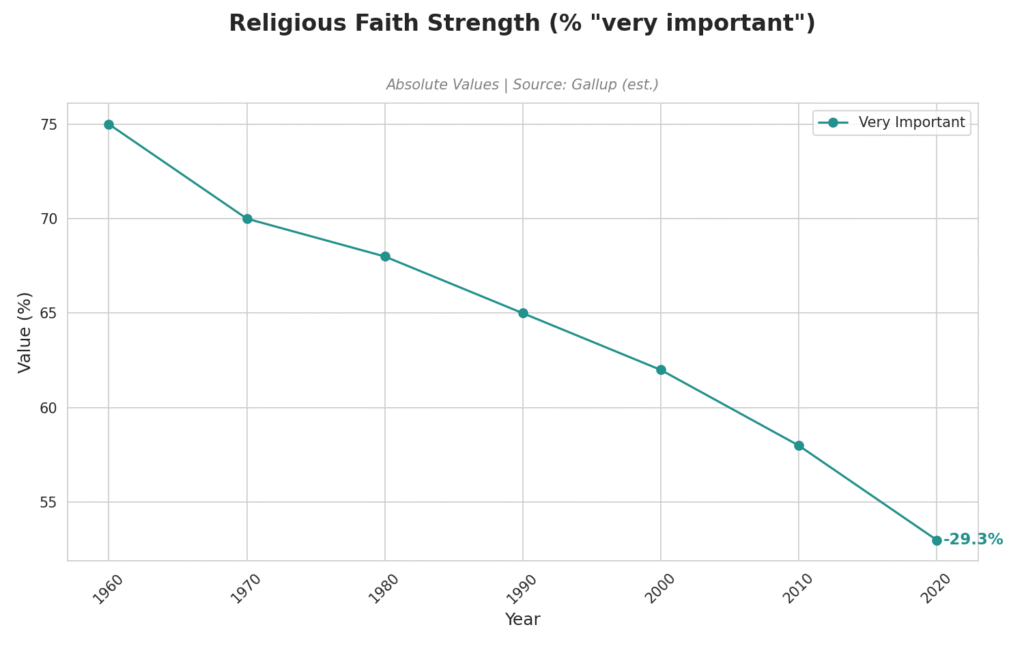
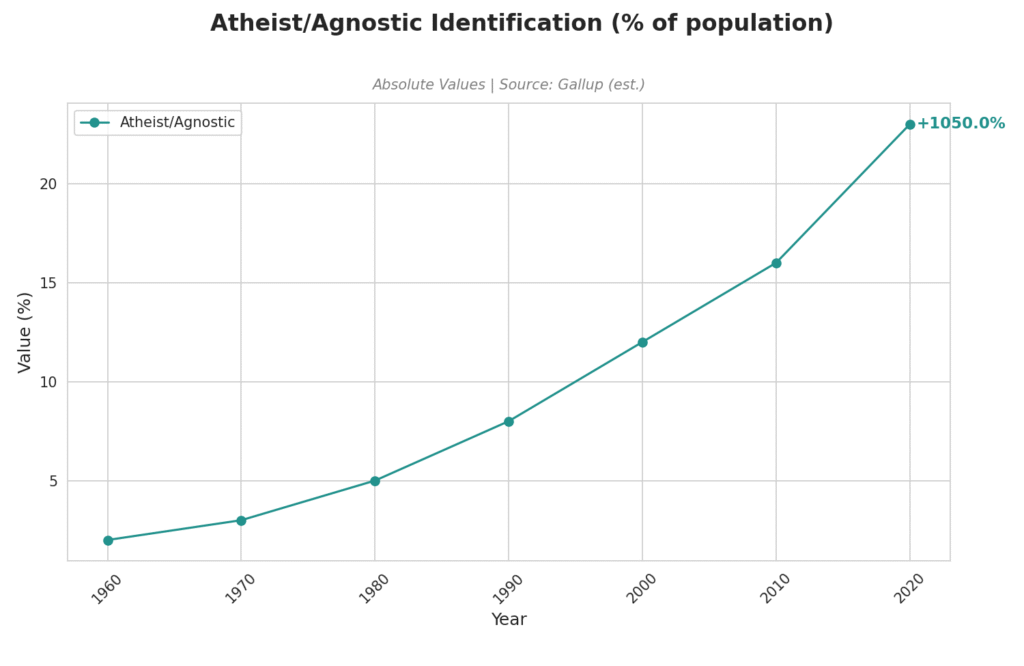


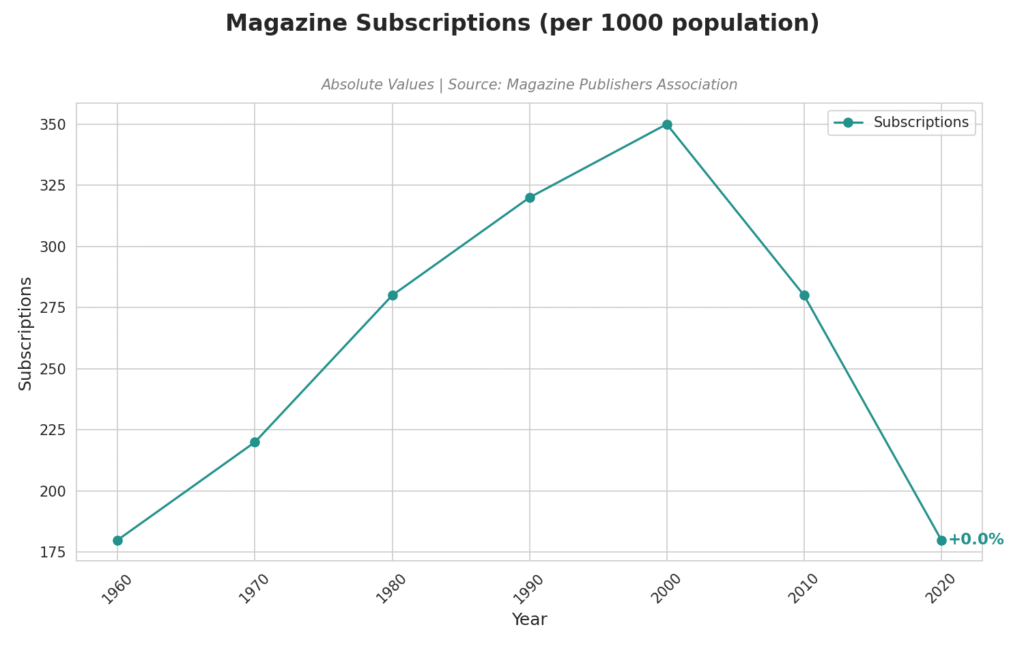
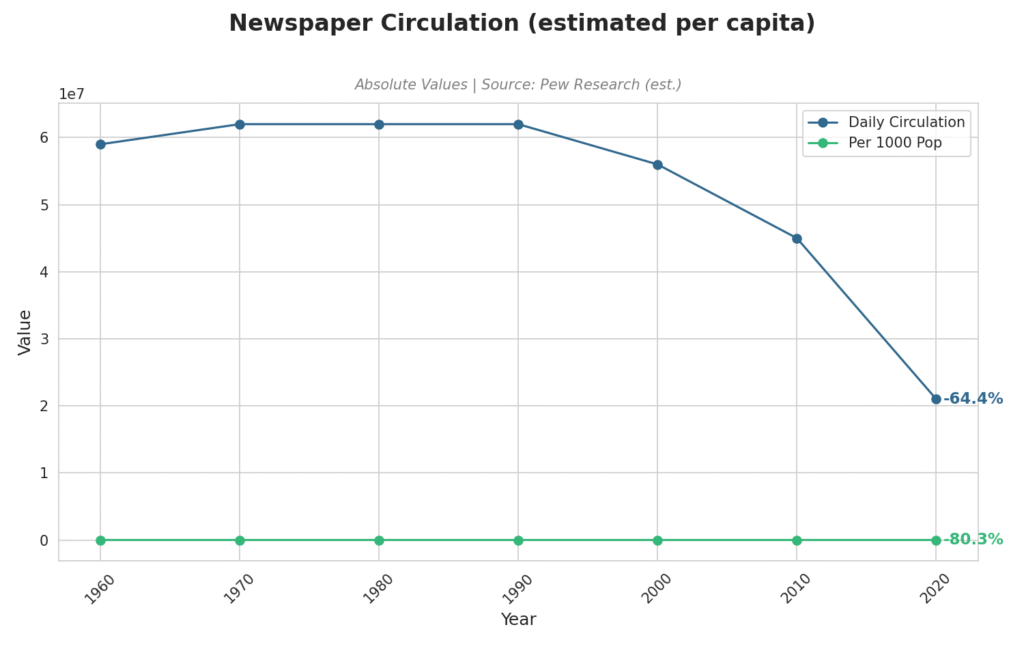
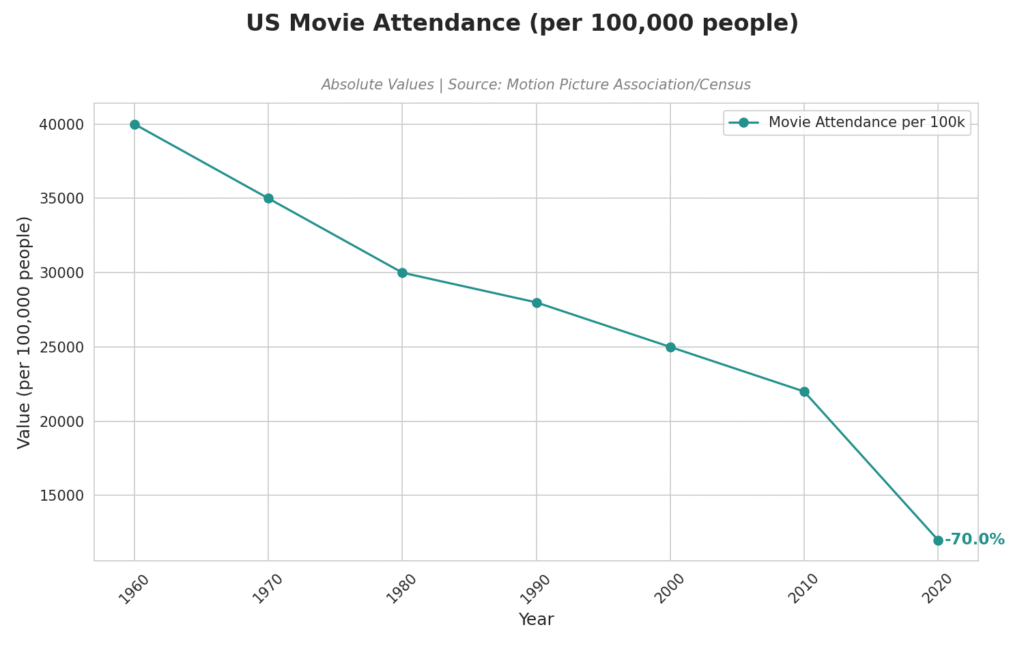
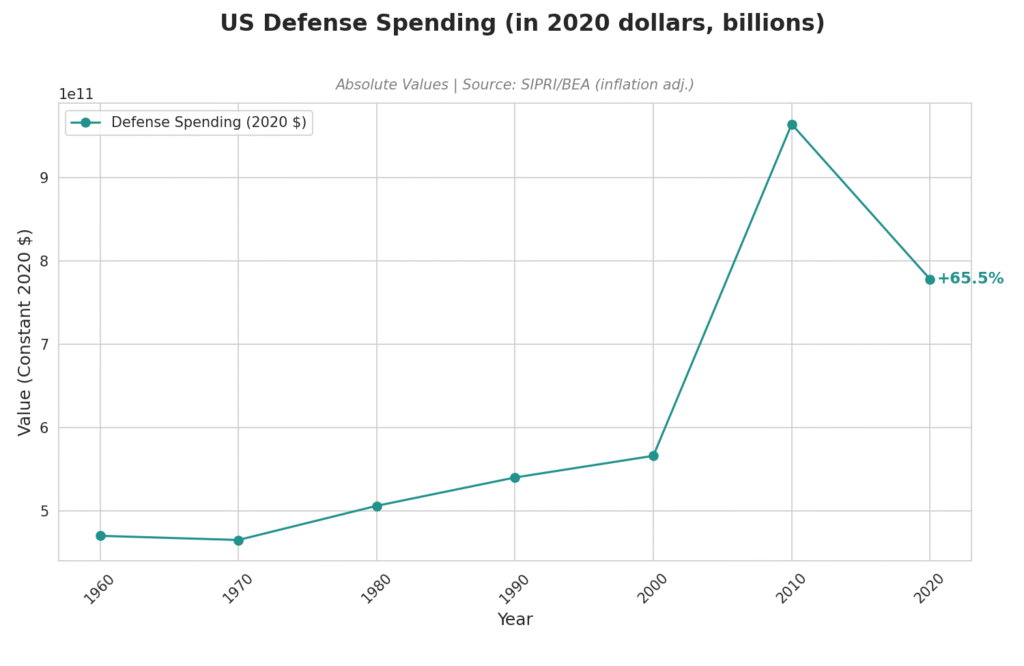
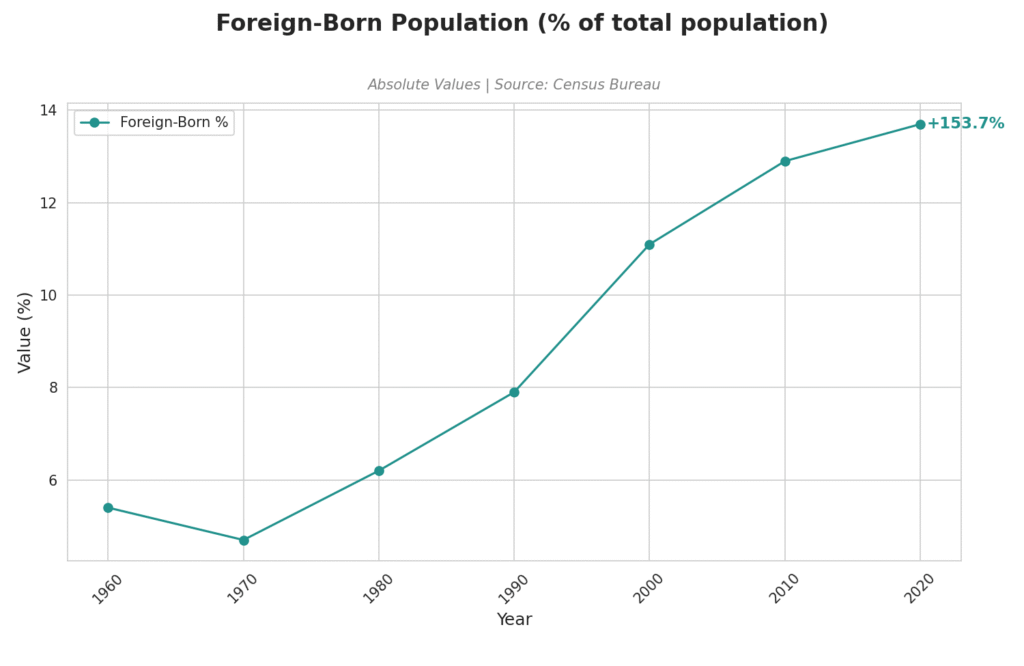
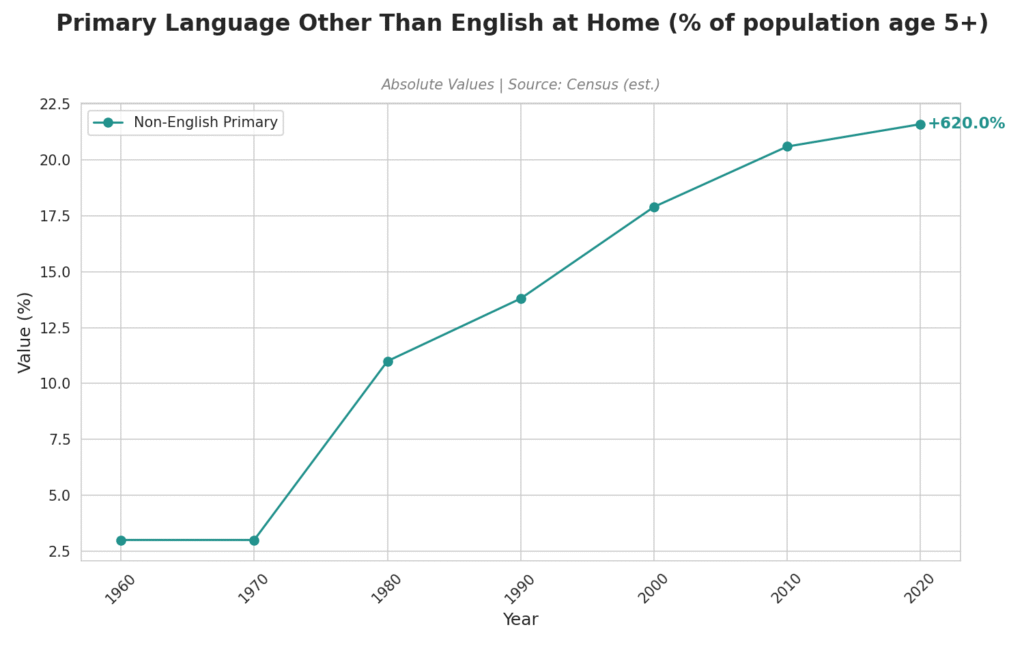
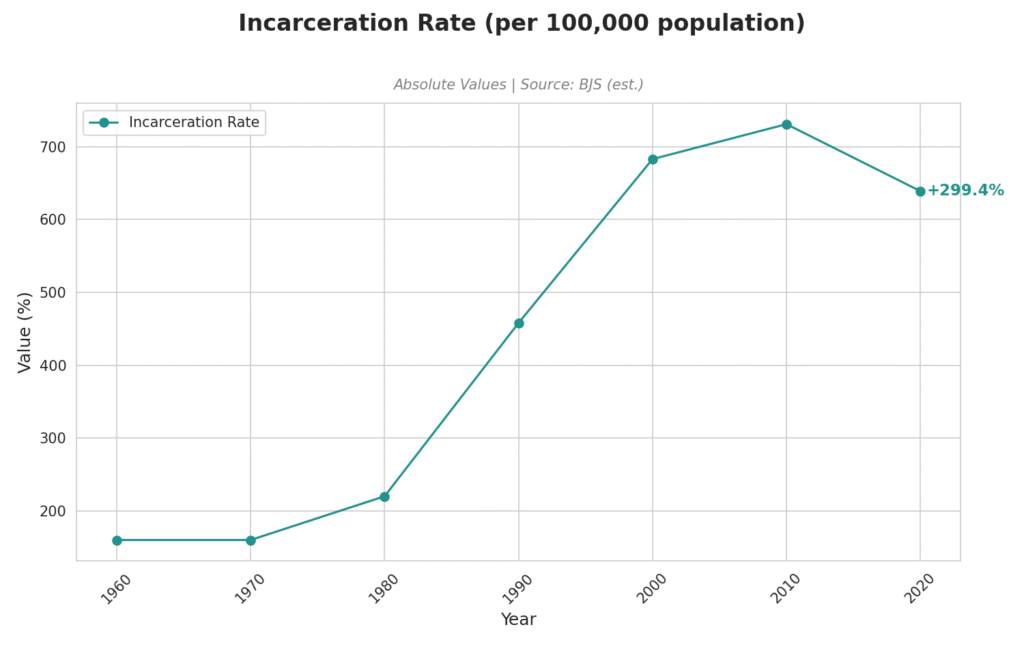
Society
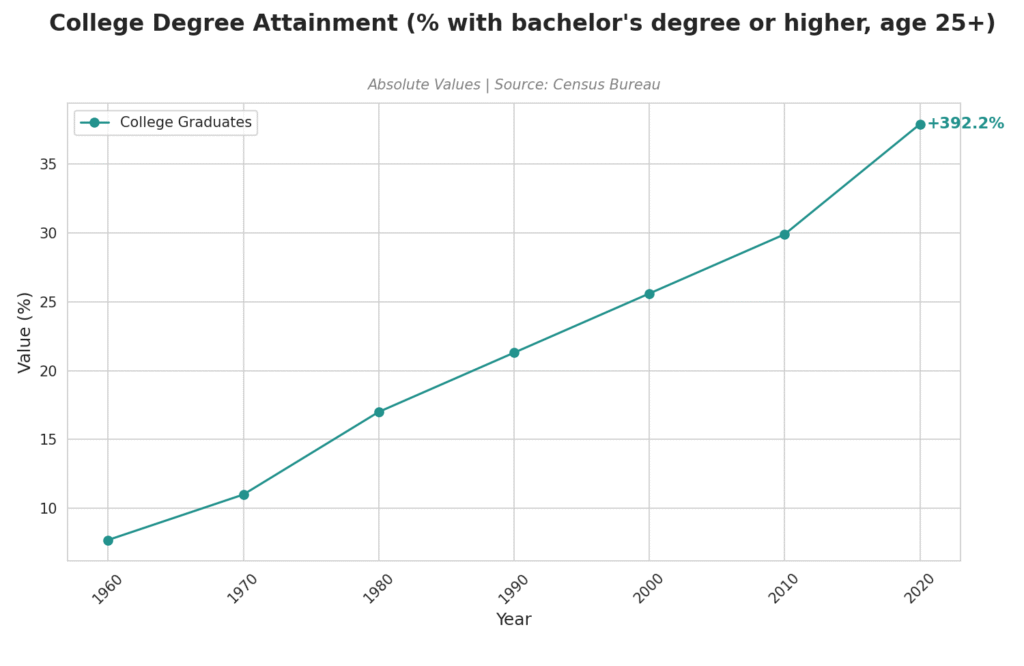
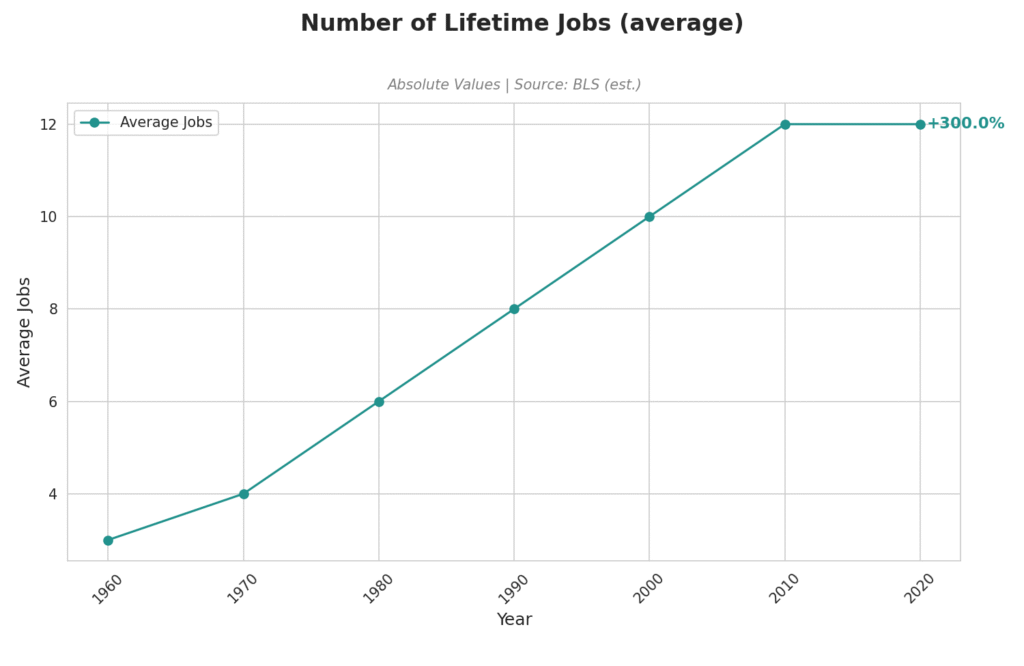
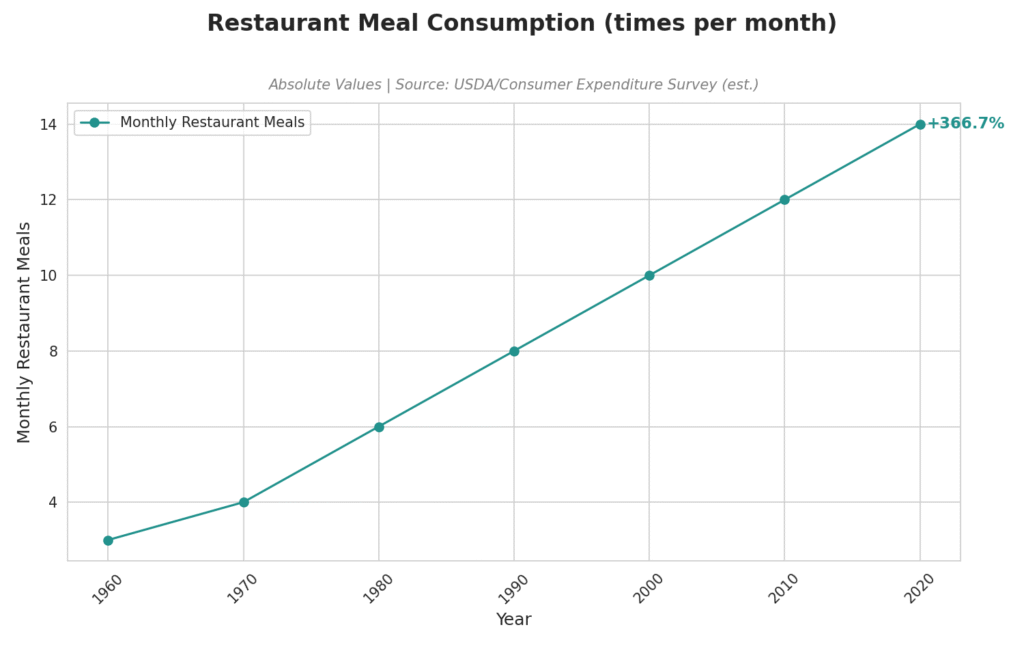
Personal
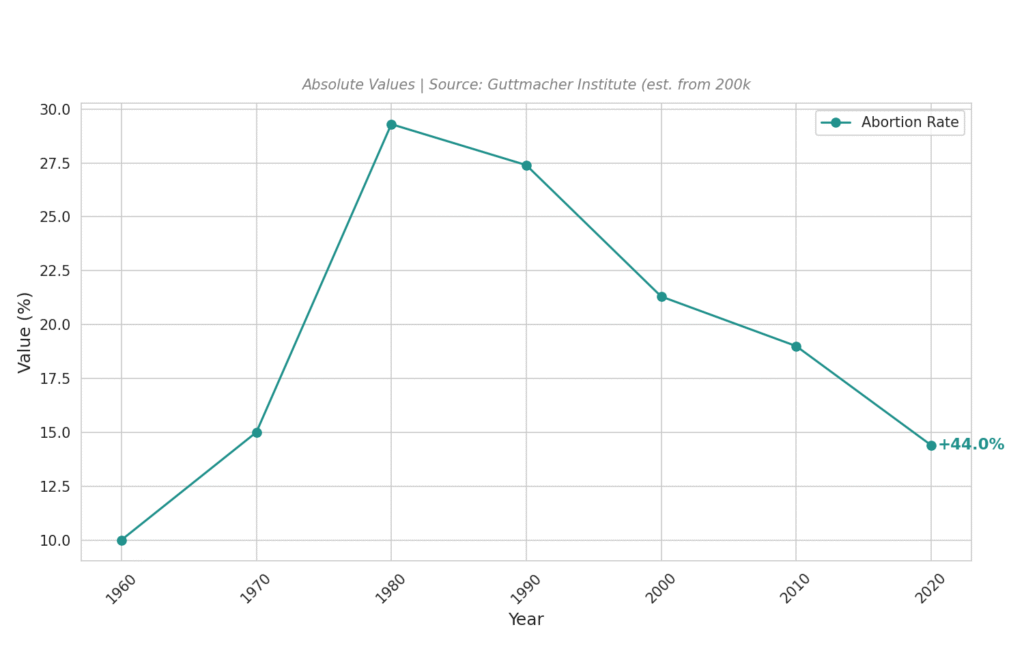
Abortions per 1,000 women (age 15 – 44)